First-click tests and preference tests
A first-click test asks people to click on a picture, such as a page design, a shelf or a map, and shows where they clicked first and how many hit each area. A preference test shows 2 or 3 pictures side by side and asks which one people prefer.
Both are questions in a ConductExperience questionnaire, so they sit beside the study's other questions, tests, images and video, and every click and choice is in the download.
Click questions
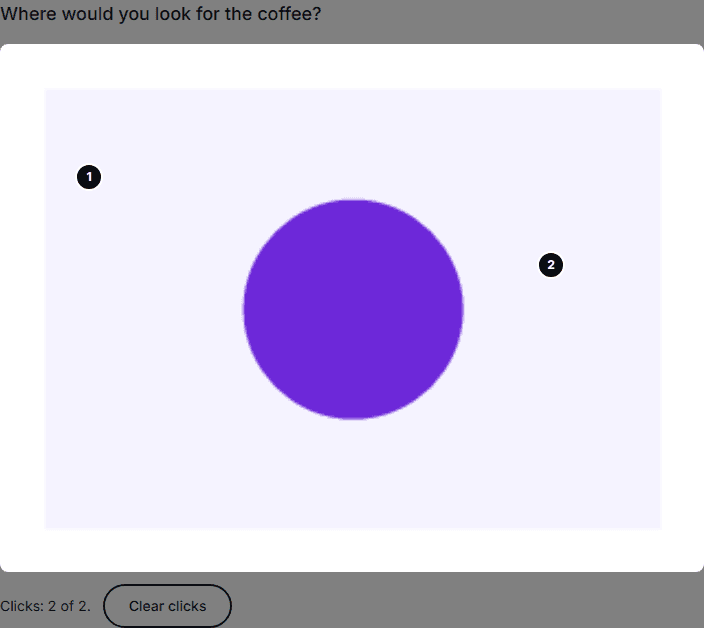
- A click question shows one of the study's pictures and takes up to the number of clicks you set, from 1 to 5. A person can clear their clicks and start again.
- You draw rectangles on the picture as the areas, each with a name for the data and a label, and a click question needs at least one. A click counts for the area it hits, or for the smaller of two areas that hold it.
- A person who cannot click on the picture, such as a keyboard or screen reader user, chooses an area from a list of the labels.
- Each click is saved with its place in the picture's own pixels, its time on the session clock and the area it hit.
- A heat map that takes 1 to 5 clicks, or a hot spot question that turns up to 5 areas on or off, in a .qsf file from Qualtrics comes over as a click question. An area that is not a rectangle comes over as the rectangle around it. Pick the study's own picture for it.
Preference tests
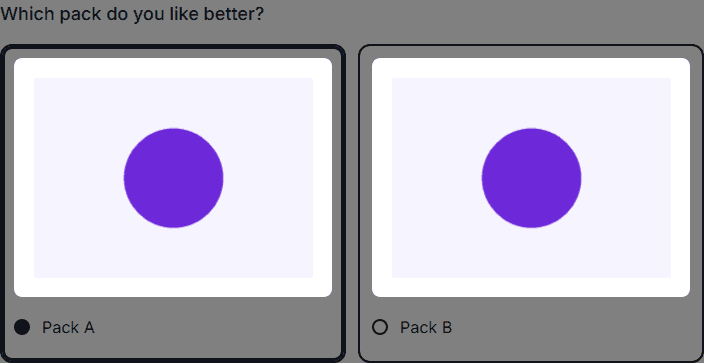
- A preference test is an image choice of 2 or 3 pictures side by side, stacked on a phone, with one answer.
- The pictures are shuffled for each person unless you turn off Shuffle options, since the side a picture is on can sway the choice.
- The answers table holds the picture chosen and, in a column of its own, its place: 1 for the left or the top.
- Results shows each picture's share of the choices.
What Results shows
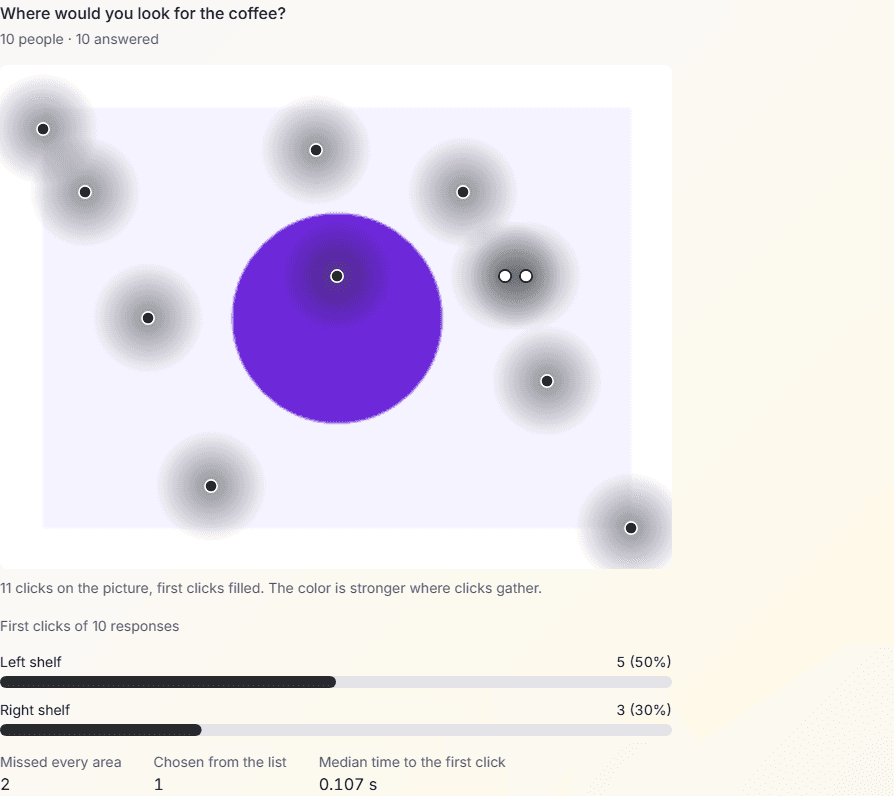
- The picture with a dot for every click on it, first clicks filled. The color is stronger where clicks gather.
- Each area's share of first clicks, how many missed every area and how many were chosen from the list.
- The median time from the start of the screen to the first click.
- Filtered by version, group, status and start date. Excluded people are left out unless you include them, and one line gives the counts for the paper: started, finished, excluded by reason and analyzed.
What the download holds
A study with a click question has a clicks.csv, with a row for each click, the person's ID and status, the part, the questionnaire and the question, and these columns:
| Column | What it holds |
|---|---|
| click | The click's number, in the order the person made them. |
| x, y | Where the click was, in the picture's own pixels from its left and top edges. Blank when the person chose the area from the list. |
| ms | When the click was made, in milliseconds on the session clock. |
| area | The name of the area the click hit. Blank for a miss. |
| picked | True when the person chose the area from the list instead of clicking on the picture. |
| from_page_ms | How long after the question's screen was shown the click was made, in milliseconds. Blank when the session holds no start for the screen. |
How to build one
- Add a questionnaire part to a study, then a question: Click on a picture or Preference test.
- Choose the picture from the study's images, or upload images on the question's card.
- For a click question, draw the areas and set the clicks a person may make. For a preference test, give each option a picture.
- Run Check, preview the study as a participant, and publish it.
Limits
- Each runs on links, tablets, later visits and in the lab. A check-in cannot ask a click question.
- A click question records clicks on a picture, not mouse movements or tasks on a live website.
- Files for REDCap leave out a click question, and take a preference test with its labels, without its pictures or the side chosen. The clicks and the side stay in the download.
Related
Survey software
Every question type of the questionnaire editor, with rules, scores and languages.
Data export
Every table of a study, clicks.csv among them, with a data dictionary entry for every column.
Open a .qsf survey file
Bring in a survey you built elsewhere, and read the report before anything is added.
Online studies
One link for a panel or a mailing list, with a completion code at the end.
Planning a study?
Start one now, or tell us what you want to measure.